FFT是指离散傅里叶变换的快速算法,可将时域信号变换为频域。
在MATLAB中做FFT,首先编写函数,对不同的采样频率和采样点数,计算FFT后的频率序列及其对应的幅值:
function [f amplitude] = yopheeFFT(sampleRate,FFT_points)    n = 0:FFT_points-1;    t = n/sampleRate; %采样时间序列    f_All = n*sampleRate/FFT_points; %频率序列
    %构造混有噪声的周期信号并采样    signal = 2*sin(2*pi*10*t)+1*sin(2*pi*20.25*t)+0.2*randn(size(t));
    %对信号进行快速Fourier变换,并求振幅    amplitude_All = abs(fft(signal,FFT_points))*2/FFT_points;
    f = f_All(1:FFT_points/2);    amplitude = amplitude_All(1:FFT_points/2);
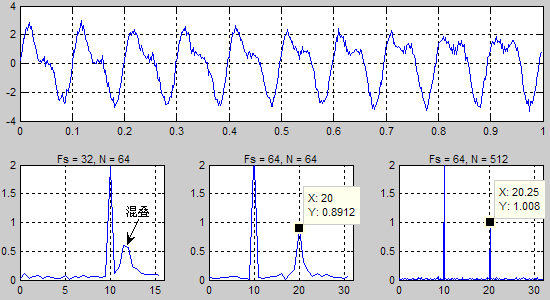
其中时域信号为幅值2、频率10Hz和幅值1、频率20.25Hz的两个正弦信号和一个噪声信号的叠加。
指定不同的采样频率和采样点数,调用函数做FFT计算,并绘图显示:
sampleRate = 32; %采样频率FFT_points = 64; %采样点数[f amplitude] = yopheeFFT(sampleRate,FFT_points);plot(f,amplitude);
sampleRate = 64;FFT_points = 64;[f amplitude] = yopheeFFT(sampleRate,FFT_points);plot(f,amplitude);
sampleRate = 64;FFT_points = 512;[f amplitude] = yopheeFFT(sampleRate,FFT_points);plot(f,amplitude);
图片上方为时域信号。下左图采样频率低于信号成分最高频率的2倍,未识别出信号中20.25Hz的频率成分,并且出现混叠。下中图频率分辨率为1Hz,将20.25Hz识别为20Hz。
总结:
- FFT频谱图具有对称性,显示一半即可
- FFT计算结果乘以2除以采样点数得到真实振幅
- FFT频率分辨率 = 采样频率 / 采样点数
- 采样频率应大于信号中最高频率的2倍